On-Chip LLM: Serving an FPGA to Strangers
Browser to transistor: a Cloudflare tunnel, a serving box, a Tailscale link, and the trick that lands a reply the instant you press Enter.
Part of the on-chip LLM on a $250 FPGA series. The fabric being fast does not mean a reply lands fast, and getting one to a browser at all is its own small system.
There are two public hostnames doing two completely different jobs. chat.mikeayles.com is the chat, and it has to be a long-lived WebSocket: A persistent two-way connection between browser and server, unlike ordinary HTTP's request-then-hang-up. What lets the chat stream characters live. because it is talking to an FPGA over the LAN, so it runs through a Cloudflare named tunnel: Cloudflare Tunnel: exposes a service to the internet without a static IP or open ports, with TLS and a DDoS buffer in front. to a serving box (the “Precision”), which batches and streams and then talks to the Kria’s Arm daemon over a wired Tailscale: The mesh VPN used to reach the board, and the wired link from the serving box to the Kria. link, and the daemon is the only thing with /dev/mem: Memory-Mapped I/O: the CPU reads and writes the fabric's registers as if they were memory addresses, via the /dev/mem device on Linux. access to poke the fabric. The A53: The quad-core Arm Cortex-A53 CPU on the KV260 (~1.33 GHz). The baseline the fabric is compared against, and the orchestrator when the CPU is in the loop. is simply a pipe: it gets a request from the server, manages a queue, feeds a string in, and gets a hopefully longer string back a few milliseconds later.
dash.mikeayles.com is the live load dashboard, and it is a stateless Cloudflare Worker: Cloudflare Worker: code that runs at Cloudflare's edge. Used here for the stateless load dashboard, kept off the board on purpose., deliberately hosted off the board so it stays up at exactly the moment the board cannot. Decouple the observer from the thing being observed.
Two speeds, and only one of them is the chip
A live chatbot has two speeds, and conflating them is the fastest way to lie to yourself about how good your demo is. Fabric tok/s is how fast the silicon decodes: pure logic cycles over the clock, nothing else. Round-trip tok/s is how fast a reply lands in your browser: the fabric plus the host loop plus the network plus the tunnel. On this system they differ by more than an order of magnitude, and the gap is entirely the parts that are not the chip.
Concretely, the faithful chat decodes a full reply in about 6.6 ms of fabric time, at ~19,240 fabric tok/s by counted cycles (~21,300 measured live, see the load test below). That is the red sliver below. Everything else in the bar is tax the fabric never sees.
The first bar is the sin we started with. To get variety the chat samples instead of always taking the best token, and the sampler originally lived on the host, so every single token the A53 read all 193 logits: The model's raw output scores, one per possible next token, before they are turned into probabilities. back over /dev/mem to roll the dice. Measured, that read-back was about 58% of every reply. We were serving a ~19,000-token-per-second model through a ~1,000-token-per-second straw. Moving the sampler into the fabric with the Gumbel-max trick deleted that whole segment and lifted the localhost round trip to ~5,600 tok/s. The public number through the tunnel, ~1,658 tok/s, is what is left once you add honest transatlantic distance and the tunnel’s own hop. None of that remainder is silicon.

The reply is finished before you press Enter
Here is the part that turns the speed from a number into a feeling. Even ~1,658 round-trip tok/s means a reply takes tens of milliseconds to cross the Atlantic and stream back, and a spinner or a typewriter animation would advertise exactly the latency I want to hide. So the front end does not wait for Enter to start.
The trick rests on one property of autoregressive: Generating one token at a time, each conditioned on everything before it. The reason typing a prompt forward is append-only work. decode: typing a prompt forward is appending tokens, and a KV cache: KV cache: the stored per-layer Keys and Values for every past token, so each new token only computes its own position instead of re-reading the whole context. is append-only. So as you type, letter by letter, each keystroke is only one new token to append to the cache, not a fresh re-read of the whole prompt, and after a short debounce the fabric speculatively decodes the answer for the prompt-so-far. At ~6.6 ms of fabric work against a typing gap of ~90 ms between keystrokes, the completion is always finished, buffered client-side, before your next key lands.
By the time you hit Enter the expensive part, the prefill: Processing the whole prompt before the first output token can appear; usually the dominant share of a chatbot's time-to-first-token. that is normally your time-to-first-token: Time To First Token: how long from hitting enter to the first character appearing. Dominated by prefill., is already spent, for free, during the gaps between keystrokes. Enter is then not a request at all. It is a blit: the client renders the buffered reply in a single 60 Hz frame, zero inference on the keypress, no round trip. The one honest failure mode is a fast typist outrunning the last speculation, so there is a freshness check: if the buffer does not match the exact current input, the client fires one real authoritative inference rather than show you a stale answer. A miss converts hidden latency back into felt latency, which is why the debounce and the speculative completion length are the two knobs that matter.
Most fast-LLM demos still stream token by token, which is the honest thing to do when the round trip is your real speed. This one can pre-answer you because the model is small, on-chip, and dumb enough that a whole reply fits in the time between two keystrokes. It is the same fact from two sides again: the thing that makes it a bad assistant is the thing that lets it beat your fingers.
Why a crowd suits the fabric
Single-user decode is the fabric’s weakest case. One person typing makes each layer a GEMV: General Matrix-Vector multiply. Generating one token at a time makes every linear layer a matrix-times-vector, which is the bulk of the work., a skinny vector through a huge MAC: Multiply-ACcumulate: the one-multiply-one-add operation matrix multiplies are built from. The fundamental unit of compute here. grid that mostly sits idle. Batch B users together and each step becomes a GEMM: General Matrix-Matrix multiply.: the resident weights are read once and reused across all B streams, and the array that was idle under one user fills up. The weakness under one user and the strength under many are the same fact seen from two sides. This is the inverse of the usual GPU serving problem, where you must assemble big batches to hide DDR latency; here the weights never leave on-chip, so there is no latency to hide and batching is pure upside.
The ceiling on B is memory, not compute. Each concurrent stream needs its own KV cache, those caches live on-chip beside the model, and the short context the design already mandates is what keeps each one small enough that a fair few fit. Within batch capacity everyone is served at full speed; past it, requests queue and per-user latency grows with queue depth. Watching that queue form on the live dashboard is the drama.
The load test
That queueing model is now measured, not just predicted. A bench sweep against the readable-English build at 200 MHz, 1 to 2,000 concurrent connections, roughly 12,000 replies in total:
| Conns | Completed | Errors | p95 latency | Fabric tok/s |
|---|---|---|---|---|
| 1 | 461 | 0 | 30 ms | 21,479 (peak) |
| 100 | 1,786 | 0 | 545 ms | 21,185 |
| 250 | 1,968 | 0 | 1.3 s | 21,188 |
| 500 | 2,329 | 0 | 2.4 s | 21,292 |
| 1,000 | 2,823 | 0 | 4.4 s | 21,371 |
| 2,000 | 3,702 | 0 | 9.4 s | 21,344 |
The two interesting columns tell the whole story. Fabric throughput is flat: ~21,300 tok/s at one connection and ~21,300 at two thousand. It was never a lone-user number. And p95 latency grows exactly the way a queue grows, 30 ms at one connection to 9.4 seconds at two thousand: that is queue depth felt from the outside, precisely the behaviour predicted above. Zero errors, zero empty replies, zero drops across the sweep, and the serving box peaked at a load of 0.62 on 12 cores. The chip never noticed the crowd. The crowd just formed a line.
A note on the number: the conservative counted-cycle figure for the faithful build is 19,242 tok/s over a full 127-token message, and that stands as the deterministic quote. The live operating throughput comes out higher because the readable-English model writes longer grammatical sentences, and a longer reply amortizes the fixed per-inference overhead over more characters. Kevin, telegraphic by design, benched ~19,500 on the same bitstream for exactly the mirrored reason.
The honest bottleneck
Named in advance: if this ever gets a real crowd, the thing that breaks first is almost certainly the Arm core’s network stack holding thousands of concurrent WebSocket connections, not the fabric running out of inference. The fabric does single-digit-microsecond tokens from on-chip and has enormous headroom; the single gigabit port and four A53 cores in front of it do not. So the experiment honestly produces two numbers, not one: the inference ceiling (the fabric under synthetic local load, large) and the serving ceiling (the whole board under real traffic through its own network stack, modest). I built something so fast that the slow part is handling the sockets, and the gap between those two numbers is the actual result. The sweep above puts a floor under the serving ceiling: wherever it is, it sits past 2,000 concurrent connections, and the inference side never flinched on the way there.
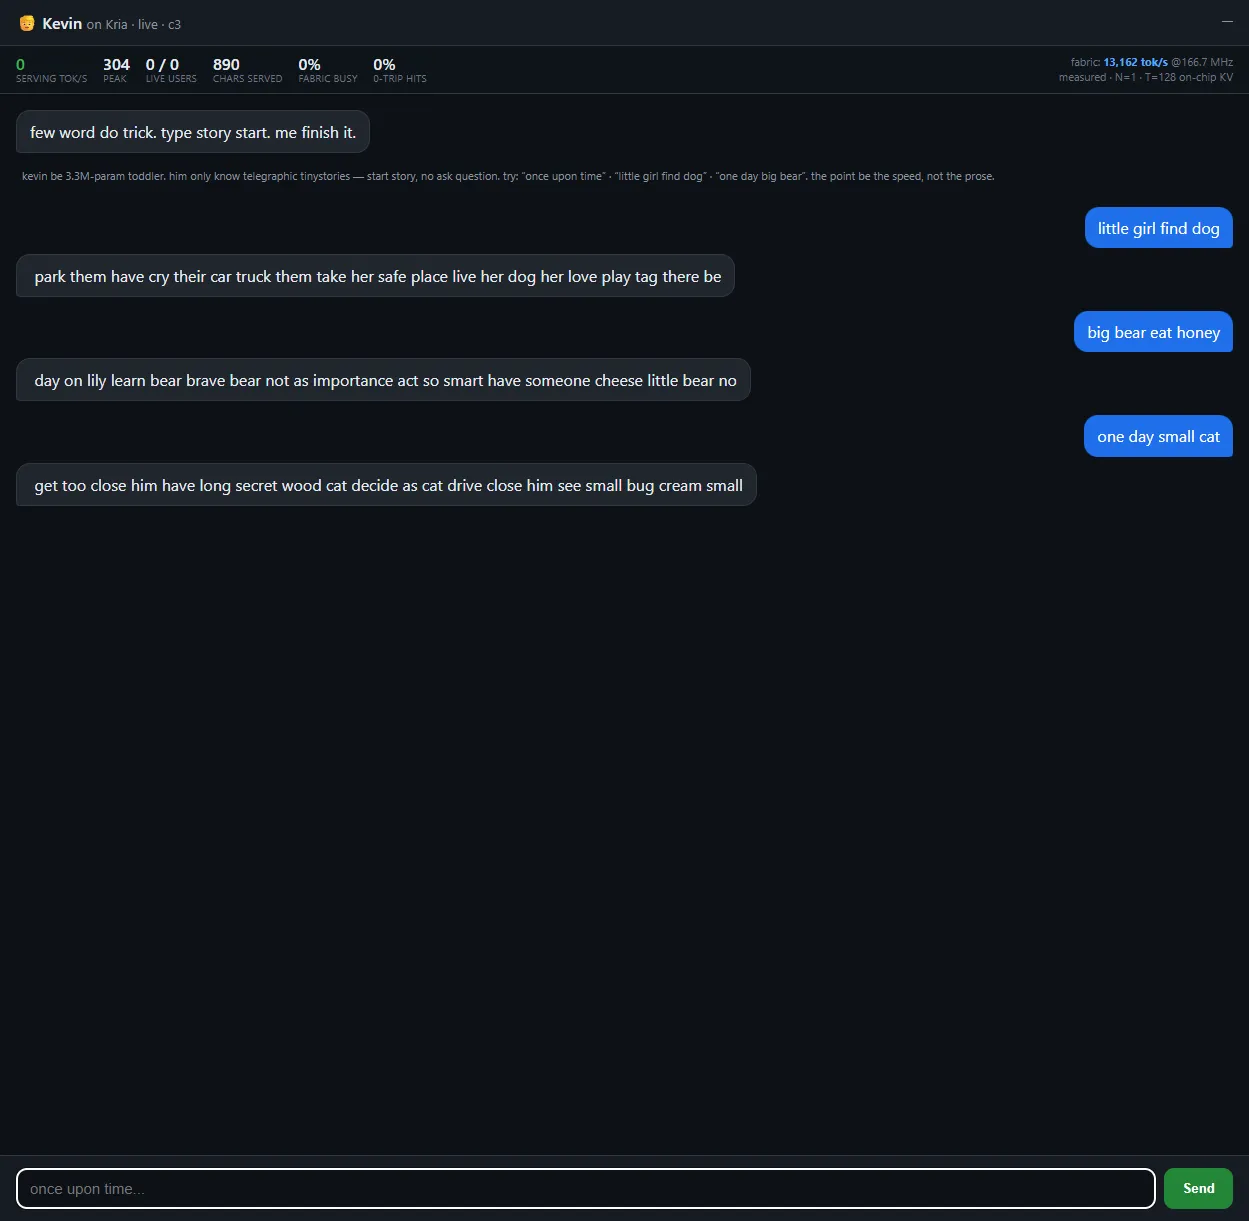
That is also why the dashboard lives on a Worker and not on the board. When the box is drowning, the page that shows it drowning has to be the one thing that stays up.
Next: War stories and the method, or back to the main post. The code is on GitHub.